You created a video. It hit 100,000 views. But your revenue dashboard shows far less than you expected. The problem is not your view count - it is your RPM.
Understanding RPM is the difference between a channel that earns $200 per 100K views and one that earns $2,000 for the exact same traffic. This guide gives you the real 2026 benchmarks, the exact formulas, and five proven strategies to push your rate higher.
Use the calculator first: Calculate your YouTube RPM free to get your personalized earnings estimate by niche before diving into the data.
What Is YouTube RPM?
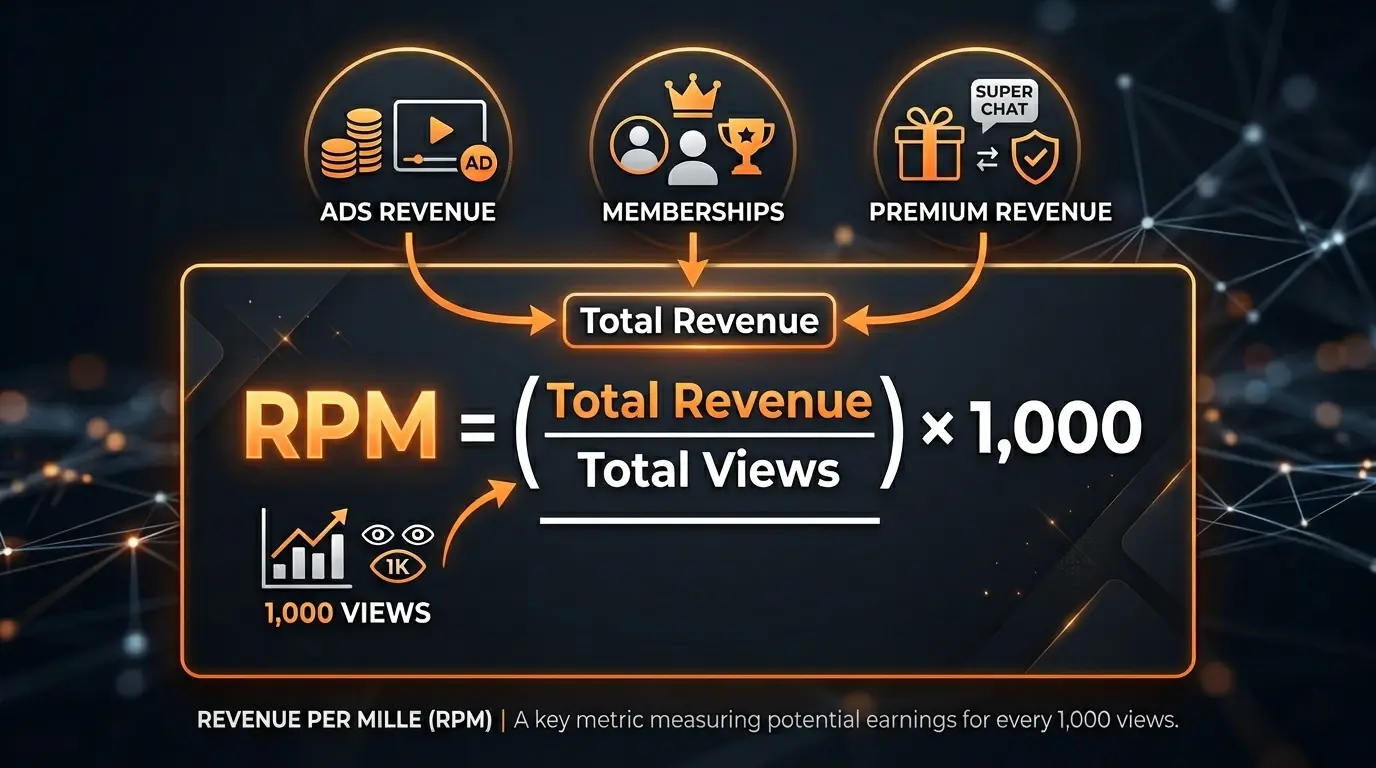
RPM (Revenue Per Mille) is the actual amount a creator earns per 1,000 video views after YouTube takes its 45% platform cut. It includes all revenue sources - ad revenue, YouTube Premium watch time, Channel Memberships, Super Chats, and Super Stickers - divided by total views.
The formula is straightforward:
RPM = (Total Revenue / Total Views) x 1,000
Unlike CPM, which only measures ad impressions, RPM is the true financial performance metric for any channel. It captures every dollar earned per thousand eyes that watched your content - whether those viewers saw an ad or not.
This matters because a live stream with 5,000 viewers can generate a higher RPM than a viral video with 500,000 views, if those 5,000 viewers contributed heavily through Super Chats and memberships. RPM reflects the complete economic value of viewer attention, not just programmatic ad placements.
RPM vs CPM - What’s the Difference?
This is the most common source of revenue miscalculation for creators. Both metrics use “per mille” (per 1,000), but they measure opposite sides of the same transaction.
| RPM | CPM | |
|---|---|---|
| Who? | Creator | Advertiser |
| Measures | Your actual earnings | Gross ad cost |
| Per 1,000 | Total video views | Ad impressions served |
| Includes | All revenue sources | Ads only |
| Higher means | Better for you | More advertiser demand |
Why RPM is always lower than CPM:
- YouTube keeps 45% of all ad revenue before paying creators
- CPM counts only successful ad impressions - RPM divides by all views, including non-monetized ones (ad-blockers, unmonetized regions, skipped pre-rolls)
- CPM ignores Premium watch time and fan-funding - RPM includes them
In practice, a channel’s RPM is typically 40-60% of its reported CPM. If your analytics show a $6 CPM, your actual RPM will likely land between $2.40 and $3.60.
Calculate your earnings using both CPM and RPM inputs to see the exact spread for your specific niche and audience geography.
What Is a Good YouTube RPM in 2026?
The answer depends entirely on your content category. There is no single universal benchmark.
| Tier | RPM Range | Typical Niches |
|---|---|---|
| 🏆 Elite | $20-$45+ | Finance, Investing, Legal |
| 🔵 Great | $8-$20 | Health, Tech, B2B Software |
| 🟢 Good | $3-$8 | Education, Travel, Food |
| 🔴 Low | Under $2 | Gaming, Entertainment, Music |
A lifestyle creator earning $5.50 per thousand views is performing exceptionally. A personal finance channel at that exact same rate is severely underperforming - the baseline expectation in finance is $12 to $45.
The key driver is Customer Lifetime Value (CLV). Financial institutions, insurance companies, and B2B software vendors know that acquiring one customer can yield thousands of dollars over years. They bid aggressively in programmatic auctions because the math works. An advertiser paying $60 per acquisition on a mortgage tutorial is executing a highly profitable transaction.
Content categories with low CLV advertisers (mobile games, fast food, entertainment) cannot sustain high ad rates regardless of view count - the economics do not support it.
YouTube RPM by Niche - Full Benchmarks (2026)
The variance in RPM across content categories is the single most influential lever available to any creator. A specialized finance channel with 50,000 monthly views can produce higher gross profit than an entertainment channel with 500,000 monthly views.
| Niche | RPM Range | Best Months |
|---|---|---|
| Finance & Investing | $12-$45 | Q1, Q4 |
| Health & Fitness | $8-$20 | Jan, Sep |
| Tech & Software | $8-$18 | Q4 |
| Education | $5-$15 | Sep, Jan |
| Travel | $4-$12 | Summer |
| Food & Cooking | $3-$8 | Nov, Dec |
| Gaming | $2-$8 | Q4 |
| Entertainment | $2-$6 | Q4 |
Finance: The Highest-Paying Niche ($12-$45)
Finance consistently delivers the highest RPM on the platform - often 900% above the baseline for entertainment content. Banks, online brokerages, tax software providers, and insurance carriers bid aggressively because acquiring a single customer can generate tens of thousands of dollars in lifetime revenue.
Sub-niches that push rates above $30: institutional trading, commercial real estate, wealth management, and high-limit credit cards. A video about budgeting basics might pull $12-$15. A tutorial on dividend investing or mortgage refinancing regularly exceeds $30.
Health and Tech: The Mid-Tier Premium ($8-$20)
Health content benefits from pharmaceutical advertising, nutraceuticals, and high-end fitness equipment. The seasonality is extreme - January drives absolute peak rates as fitness-related resolutions push advertisers to compete hard for viewer attention.
Tech earns premium rates specifically in B2B sub-niches: enterprise software reviews, SaaS platform comparisons, cloud computing, and AI business tools. A consumer smartphone unboxing generates $4-$8. A video comparing $5,000-per-month enterprise tools targets buyers who justify premium ad rates.
Gaming and Entertainment: Volume Over Value ($2-$8)
Despite generating the highest aggregate viewership on the platform, gaming and entertainment earn the lowest RPM. Advertisers in these categories - mobile game studios, movie studios, fast food - sell low-margin products to audiences with lower disposable income and minimal commercial intent.
A viewer watching a 30-minute gaming compilation is unlikely to pause for a financial product. For creators in these niches, programmatic ad revenue alone rarely sustains a business. Sponsorships, merchandise, and memberships are essential.
YouTube RPM by Country - Top Markets (2026)
Audience geography sets the floor for your earnings potential, regardless of niche. The geographic tier system is driven by GDP, consumer purchasing power, and the maturity of local digital advertising markets.
| Country / Region | Estimated RPM (2026) |
|---|---|
| 🇺🇸 United States | $4-$12 |
| 🇬🇧 United Kingdom | $4-$10 |
| 🇨🇦 Canada | $3-$9 |
| 🇦🇺 Australia | $3-$8 |
| 🇩🇪 Germany | $3-$8 |
| 🇳🇴 Norway / Switzerland | $5-$14 |
| 🇮🇳 India | $0.5-$2 |
| 🇲🇦 Morocco / MENA | $0.8-$2.5 |
The United States remains the gold standard. American consumers carry high levels of disposable credit and are deeply accustomed to frictionless e-commerce. When a viewer in Texas watches a personal finance video, advertisers bid in real time knowing that viewer has the purchasing power to act.
India represents one of the largest viewer bases on the platform but generates rates of $0.50-$2.00. The supply of ad inventory vastly exceeds demand from both local and international advertisers operating in the region. A massive volume of views at low rates can still build a sustainable business, but the path requires either volume-driven monetization or a pivot toward higher-paying audience geography.
A critical 2026 development: AI dubbing and audio localization tools have disrupted the geographic tier system. Creators based in Tier 3 regions can now access Tier 1 ad rates by translating content into English, German, or French - systematically shifting their viewership demographics into higher-paying markets.
How to Find Your RPM in YouTube Studio
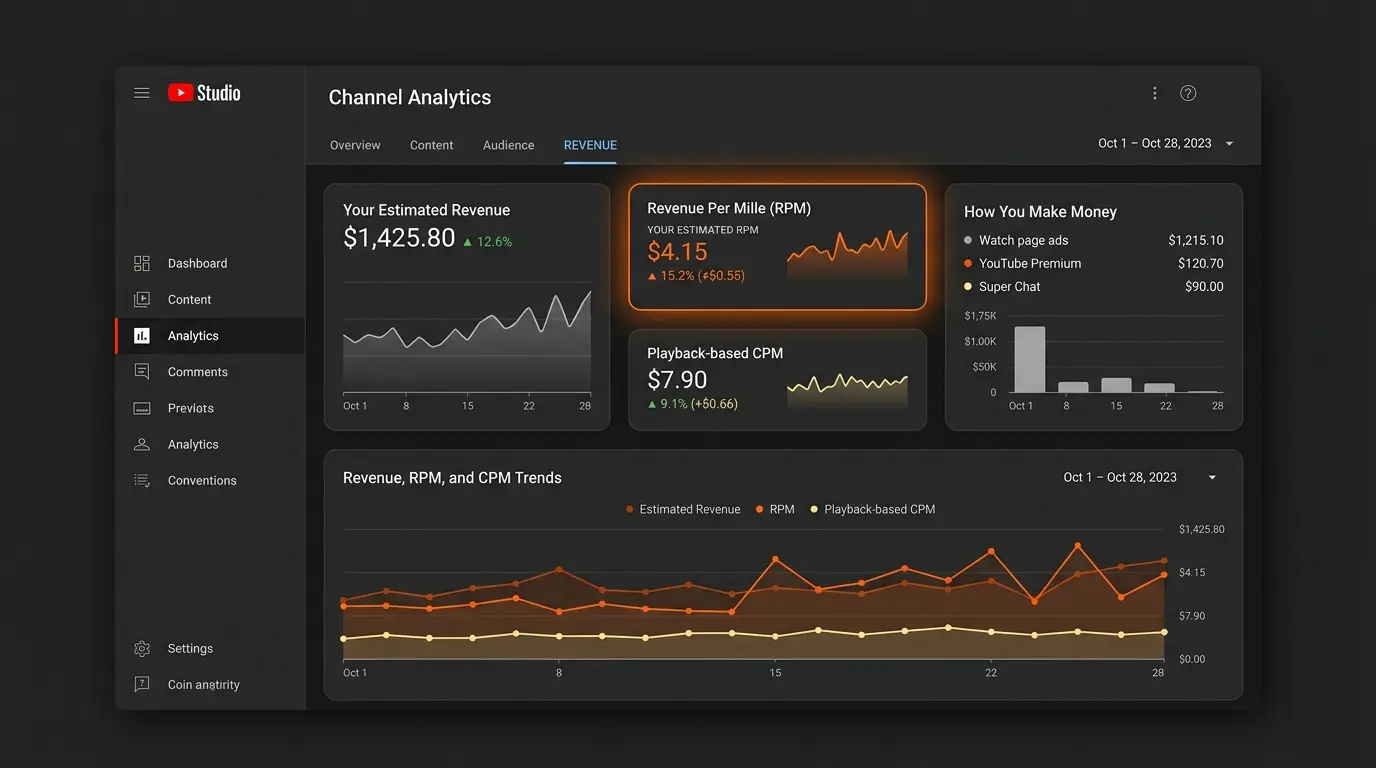
Your RPM is visible in YouTube Studio Analytics, but the exact path and interpretation require knowing where to look.
Step-by-step:
- Log into YouTube Studio via desktop browser or the mobile app
- Select Analytics from the left-hand navigation
- Click the Revenue tab in the top horizontal menu
- Your RPM is displayed as the primary KPI alongside Total Estimated Revenue
For deeper analysis, click Advanced Mode in the upper right. This allows you to filter data per video - instantly revealing which topics, formats, and video lengths command premium ad rates.
Key patterns to monitor:
- Date range comparison: Identify seasonal trends and Q4 spikes
- Per-video filtering: Find which of your videos consistently outperform your channel average
- Geography breakdown: Discover if a high percentage of your audience comes from low-CPM regions - this is often the biggest suppressor of overall RPM
Sudden drops in RPM often indicate a geographic shift in your audience (more viewers from low-paying regions) or invalid traffic filtering applied by the platform. Monitor this metric weekly during growth periods.
How to Increase Your YouTube RPM (5 Ways)
Higher view count alone does not increase RPM. The quality, geography, and structural architecture of your content determines your rate. Here are the five most effective levers based on what top-earning channels consistently apply.
1. Target High-CPM Niches
The fastest method to increase RPM is shifting editorial focus toward commercially valuable sub-topics. A cooking channel that reviews expensive smart-kitchen appliances, covers meal planning for specialized health diets, or teaches how to start a catering business will immediately trigger higher-paying ads than one posting simple recipe tutorials.
The key is aligning content with commercial intent - viewers actively seeking to solve a problem with a purchase. Advertisers pay premium rates to reach these decision-making moments.
2. Create Longer Videos (8+ Minutes)
The platform permits mid-roll ads only on videos exceeding eight minutes. A well-structured 10-minute video can house a pre-roll, two mid-roll breaks, and a post-roll - dramatically increasing ad impressions per view compared to a 5-minute video with only one ad slot.
Place mid-roll breaks right before a high-tension payoff to minimize viewer abandonment during commercials. High retention through ad breaks signals to the programmatic auction that your inventory is premium quality, pushing your baseline rates upward over time.
3. Attract US/UK/CA Audiences
Shifting your audience toward Tier 1 markets fundamentally changes your earnings per view. Practical methods:
- Optimize titles, tags, and descriptions to align with Western search trends
- Add high-quality English subtitles manually (not auto-generated)
- Use YouTube’s multi-language audio track feature for AI dubbing
- Reference cultural events, current news, and seasonal topics relevant to English-speaking markets
A channel based anywhere in the world can achieve Tier 1 rates if the majority of its watchtime comes from high-paying regions.
4. Optimize Ad Placements Manually
Do not rely entirely on automated ad insertion. Manual placement of mid-roll breaks at natural chapter transitions, title cards, or dialogue pauses prevents jarring interruptions that cause viewer abandonment.
High retention through ad breaks tells the algorithm your ad inventory is high-quality. This drives up the competitive bidding on your videos over time - increasing your baseline rate without any changes to your content.
5. Enable All Ad Formats and Alternative Revenue Streams
RPM measures total platform revenue, not just pre-roll ads. Maximizing every available revenue channel directly inflates your rate:
- Enable skippable, non-skippable, and bumper ad formats globally
- Activate Super Chats and Super Stickers during live streams
- Offer Channel Memberships with exclusive content tiers
- Enable Super Thanks on standard video uploads
A highly engaged audience using Super Thanks can literally double a specific video’s effective RPM regardless of the current advertising market conditions.
Frequently Asked Questions
What is a good RPM on YouTube? For general lifestyle and entertainment content, $3-$5 per thousand views is the standard baseline. A rate of $8 or above is objectively strong and indicates either a high-value niche (finance, B2B tech) or a heavily Tier 1 audience. Elite channels in personal finance and real estate regularly see $20-$45+. Calculate your earnings to see where your current rate stands against niche benchmarks.
Which YouTube niche has the highest RPM? Finance and investing consistently delivers the highest rates on the platform - $12 to $45, with specialized sub-niches like institutional trading and commercial real estate frequently exceeding $50. Banks and financial service companies derive immense long-term revenue from a single customer acquisition, justifying aggressive bidding on financial content.
What is the difference between RPM and CPM on YouTube? CPM is the gross amount advertisers pay per 1,000 ad impressions. RPM is the net amount creators receive per 1,000 total views after YouTube’s 45% cut, non-monetized views, and the inclusion of Premium watch time and fan-funding. Your RPM will always be 40-60% of your CPM. Both metrics are visible in the Revenue tab of YouTube Studio Analytics.
Why is my YouTube RPM so low? Four common causes: (1) Heavy audience concentration in Tier 3 geographic markets (South Asia, North Africa, Southeast Asia) where advertiser demand is weak. (2) Content niche with low commercial intent (gaming compilations, reaction videos). (3) Video runtimes consistently under eight minutes, blocking mid-roll ad eligibility. (4) High viewer use of ad-blocking software or heavy non-monetized traffic (embeds, direct links from ad-free sources).
Does RPM change by season? Yes - Q4 (October through December) drives the most dramatic platform-wide rate increases, typically 30-60% above the annual average, as global retailers deploy their remaining annual marketing budgets to capture holiday spending. This surge is immediately followed by a severe January-February drop as corporate budgets reset. Finance and health niches also see strong Q1 spikes as New Year’s resolutions drive both search volume and advertiser competition.
Final Takeaway
Your RPM is not fixed. It is a direct output of your niche selection, your audience geography, your video structure, and the monetization options you have enabled. A creator earning $1.50 per thousand views is not doing anything wrong - they may simply be reaching the wrong audience with the right content.
The most effective lever available to any creator right now is understanding exactly where their money is - and is not - coming from. Start with the data in your YouTube Studio Revenue tab, then calculate your earnings potential across different niche scenarios to see where the same effort generates significantly higher returns.
For related analysis: learn to calculate your YouTube earnings across different revenue scenarios, use CPM rates by country to identify your highest-value audience segments, and estimate your views required to hit specific annual revenue targets.
![YouTube Channel Comparison: Evaluate Any Two Creators for Free [2026]](/images/seo/youtube-channel-comparison/youtube-channel-comparison.webp)