YouTube Thumbnail A/B Testing: Best Practices & How It Works
What if you could scientifically prove which thumbnail gets more clicks? No more guessing. No more “I think this looks better.” Just data.
YouTube A/B testing for thumbnails lets creators compare designs to find what drives more clicks and views. This data-driven approach can significantly boost click-through rates (CTR), helping channels grow faster than ever before.
 Caption: A/B testing removes guesswork from thumbnail design
What is A/B Testing?
Definition & How It Works
A/B testing (also called split testing) compares two or more thumbnail versions shown randomly to different viewers, measuring which performs better via CTR or watch time.
The Process:
- Create 2-3 thumbnail variants
- YouTube shows each version to different viewers
- Data is collected on clicks and watch time
- The winning thumbnail is identified
- You apply the winner permanently
Why It’s Crucial for Growth
Thumbnails influence 70-80% of click decisions. A/B testing turns guesswork into proven strategies.
| Without A/B Testing | With A/B Testing |
|---|---|
| ”I think this looks good" | "Data shows this gets 47% more clicks” |
| Inconsistent results | Measurable improvements |
| Wasted creative effort | Every design teaches something |
| Stagnant CTR | Continuous optimization |
Success Stories
Channels using systematic testing report:
- Average 23% CTR improvement across tested videos
- Some channels doubled their CTR through iterative tests
- Ali Abdaal: Thumbnail swap led to +800k views on a single video (300k → 1.1M)
- Learn With Me: AI thumbnails + TubeBuddy tests = up to 30% engagement boost
Key Insight: The channels that grow fastest aren’t the ones with the best first-guess thumbnails—they’re the ones who test systematically.
YouTube’s Built-in “Test & Compare” Tool
YouTube launched its native A/B testing feature in 2024, making thumbnail testing accessible to all creators.
How to Access It
For New Videos:
- During upload, look for “Test & Compare” option
- Upload up to 3 thumbnail variants
- Set your test preferences
For Existing Videos:
- Go to YouTube Studio
- Navigate to Content
- Select the video you want to test
- Click the three dots (more options)
- Select “Test & Compare”
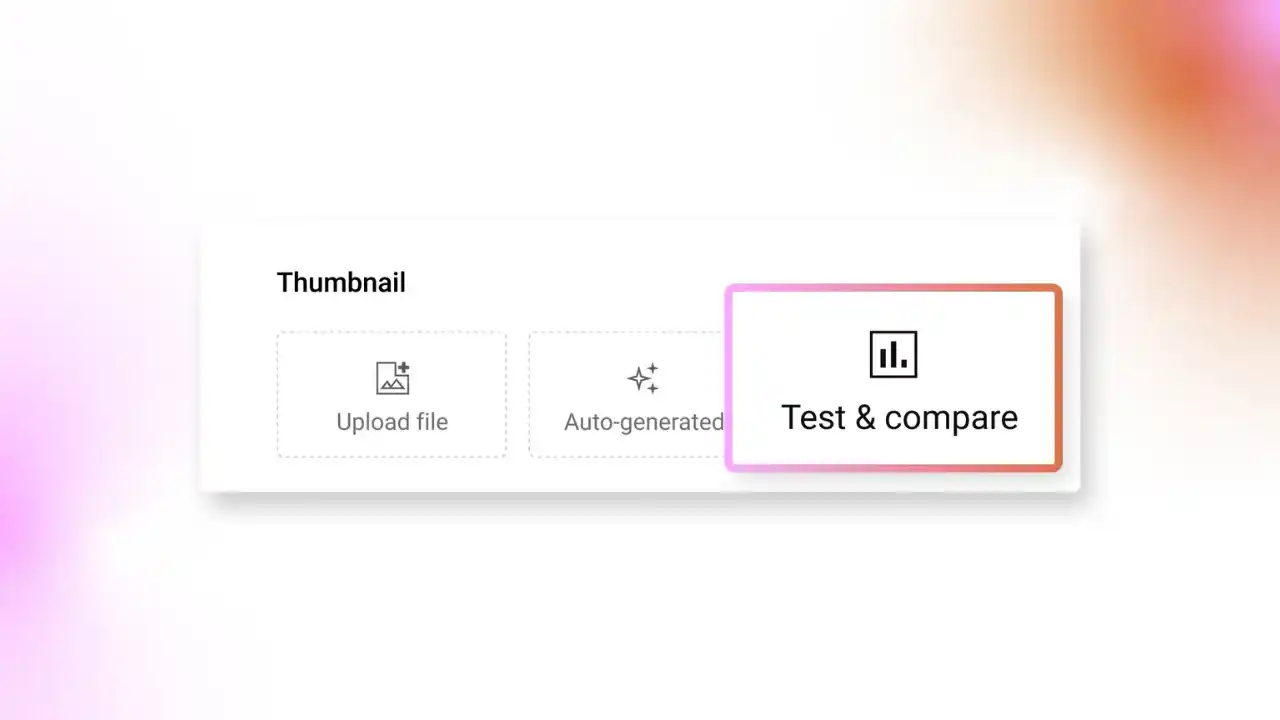 Caption: Finding the Test & Compare feature in YouTube Studio
Setting Up Tests
Step-by-Step Setup:
- Select video (new or existing)
- Upload thumbnails (2-3 variants)
- Choose metrics (watch time share recommended)
- Start test
Best Practices:
- Test one variable at a time (color, text, or expression—not all)
- Use clearly different designs (subtle changes = inconclusive results)
- Let tests run their course (don’t stop early)
Reading Results
Results appear in YouTube Studio → Analytics → Reach → Thumbnail test
Key Metrics:
- Watch time share - Which thumbnail leads to longer viewing
- Click-through rate - Raw click performance
- Impressions - How many times each was shown
Timeline: Results can appear in hours, but meaningful data typically takes 48-72 hours minimum.
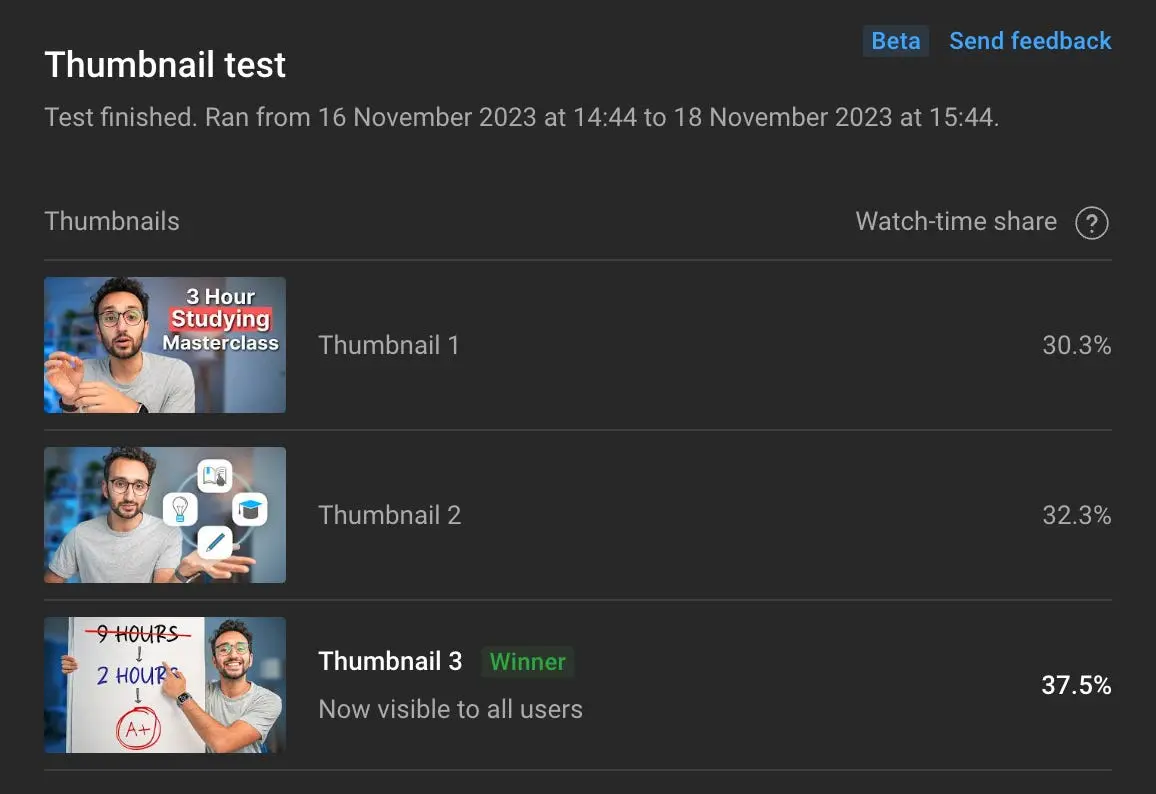
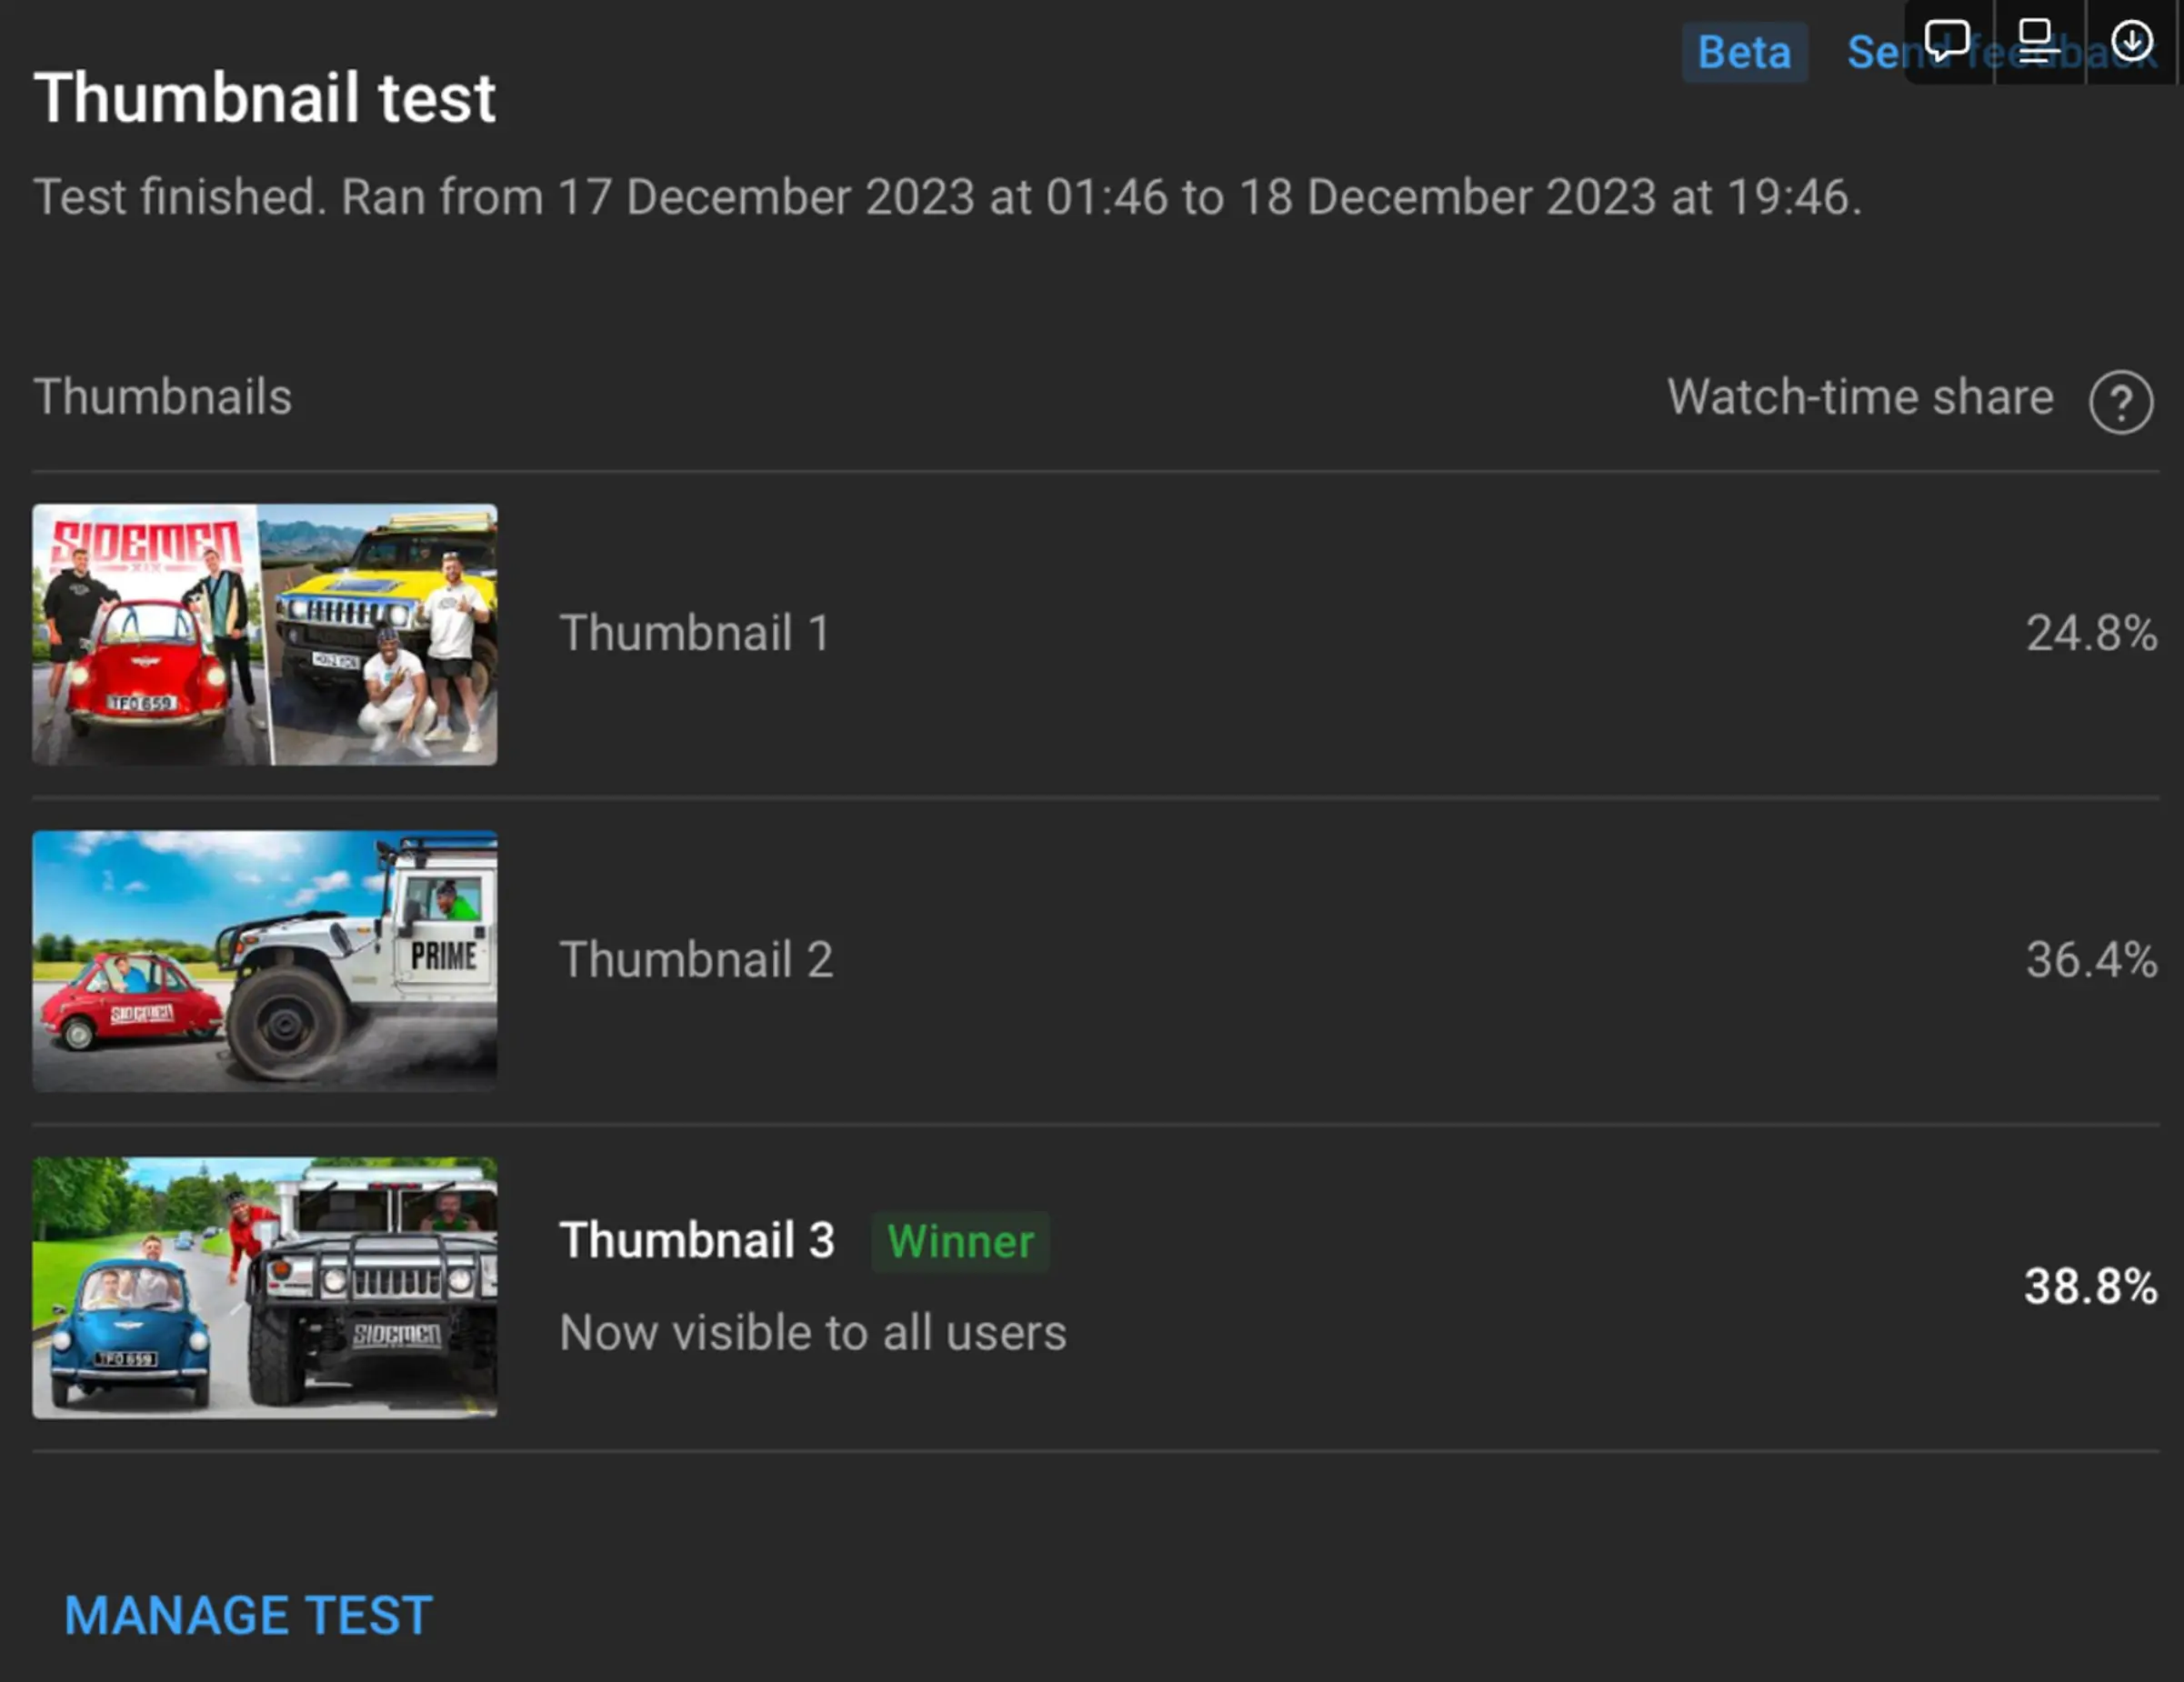 Caption: Understanding your A/B test results in YouTube Analytics
Limitations
❌ Maximum 3 variants only ❌ No title testing in basic mode ❌ Relies on YouTube traffic (can’t control sample) ❌ Inconclusive results if variants are too similar ❌ No statistical significance indicator (you calculate manually)
Third-Party A/B Testing Tools
For more control and advanced features, third-party tools fill the gaps.
Touhfa Arena - Free Community Voting A/B Test
Before any paid tool, consider Touhfa Arena - the first free thumbnail A/B testing tool powered by real community votes, not AI guesses.
How it works:
- Upload two thumbnail variants to the Arena
- Real viewers in the creator community vote on which one they would click
- Results come back in hours - not days - with a clear percentage split
- No YouTube channel requirement, no subscribers needed, no cost
Why this matters: Every other tool on this list either requires you to publish first (YouTube native tool) or costs money (TubeBuddy, ThumbnailTest). Touhfa Arena gives you genuine human feedback before a single impression is spent.
Best for: Pre-publish validation for any creator, especially newer channels with limited traffic for statistical significance.
Try it: Touhfa Thumbnail Testing Arena
TubeBuddy A/B Testing
The most popular third-party option with dedicated thumbnail testing features.
Setup Guide:
- Install TubeBuddy browser extension
- Go to A/B Tests in dashboard
- Click Create → Select video
- Choose Thumbnail Test
- Upload your variant
- Set duration or statistical significance threshold
- Start test
Pricing:
| Plan | Monthly Cost | A/B Testing |
|---|---|---|
| Free | $0 | ❌ Not included |
| Pro | $9/month | ✅ Basic testing |
| Legend | $24/month | ✅ Advanced testing |
| Enterprise | $49/month | ✅ Unlimited + priority |
Interpreting Results:
- TubeBuddy shows statistical significance (aim for 95% confidence)
- Track CTR changes over time
- View impressions per variant
- Get clear “winner” declarations
VidIQ Thumbnail Testing
VidIQ offers thumbnail analysis and hypothesis-driven testing.
Features:
- Variable isolation (test color, face, text separately)
- SEO insights integration
- Thumbnail score predictions
- Competitor analysis
Pricing:
| Plan | Monthly Cost |
|---|---|
| Basic | Free (limited) |
| Pro | $5/month |
| Boost | $39/month |
| Max | $159/month |
Best For: Combining A/B testing with broader YouTube analytics and SEO.
ThumbnailTest.com
A dedicated thumbnail testing tool with more variants than YouTube allows.
Key Features:
- Upload up to 10 thumbnails (vs YouTube’s 3)
- Set rotation frequency
- Multi-channel support
- Unlimited tests (on paid plans)
Pricing: ~$24-$75/month depending on features
Best For: Creators who want to test many variants systematically.
Sprizzy
Outsourced thumbnail design and testing services bundled together.
What They Offer:
- Professional thumbnail design
- A/B testing insights
- Optimization recommendations
Best For: Creators who want hands-off optimization services.
What to Test: Variables That Matter
Text Variables
| Test | Why It Matters |
|---|---|
| Text vs. No Text | Text overlays boost curiosity but clutter reduces appeal |
| Word Count | 3 words vs. 5 words |
| Font Style | Bold impact vs. clean sans-serif |
| Text Position | Top-left vs. center vs. bottom |
| Text Color | Yellow vs. white vs. matching brand |
Visual Variables
| Test | Why It Matters |
|---|---|
| Face vs. No Face | Faces increase clicks by 30-50% in most niches |
| Expressions | Surprised/happy outperform serious by 20-40% |
| Close-up vs. Wide | Close-ups for emotion, wide for context |
| Background Color | High-contrast or niche-matching colors lift CTR |
| Subject Position | Left vs. right vs. center |
Style Variables
| Test | Why It Matters |
|---|---|
| Bright vs. Dark | Depends on niche and competition |
| Busy vs. Minimal | Simple often wins on mobile |
| Border/Glow | Can increase visibility in feed |
| Color Scheme | Complementary colors vs. monochrome |
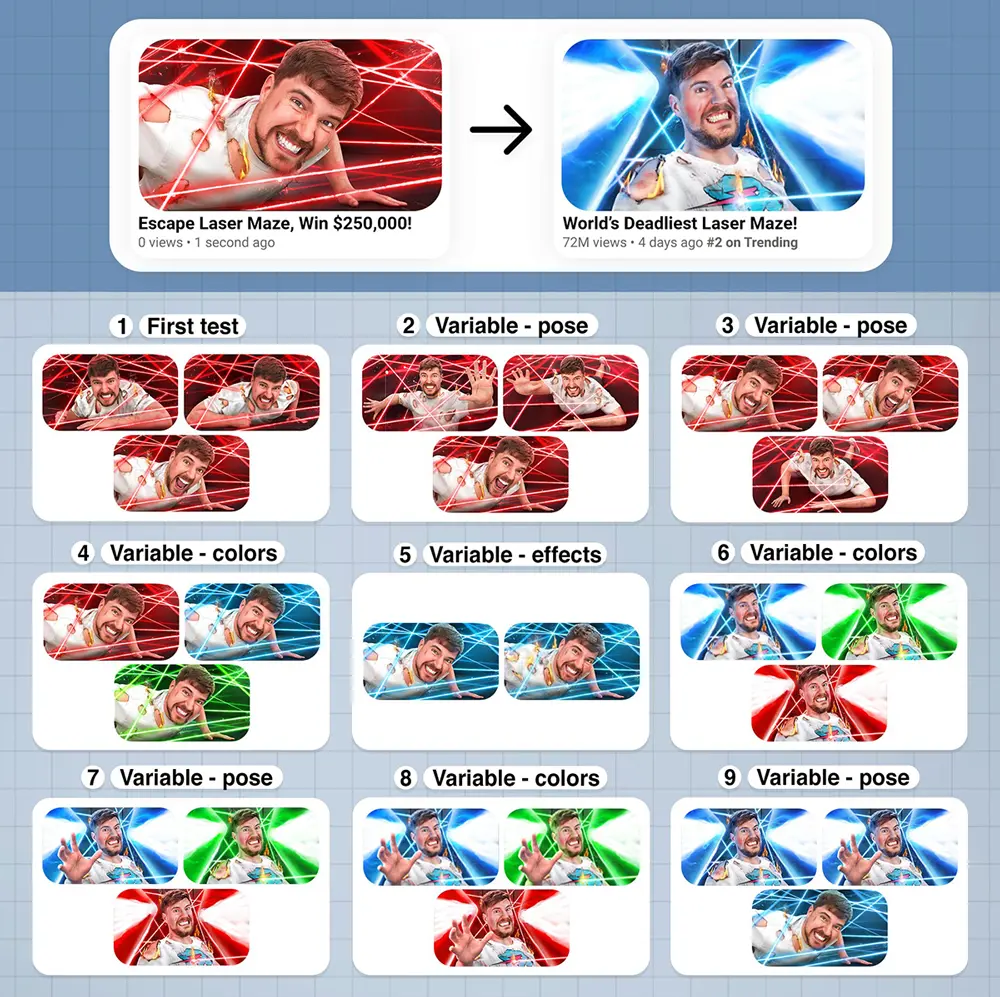 Caption: One variable at a time produces the clearest results
Testing Methodology
Sample Size Requirements
Minimum for reliable results:
- 1,000+ impressions per variant
- Ideally 5,000+ for high confidence
- More impressions = more reliable data
Test Duration
| Duration | Reliability |
|---|---|
| 24 hours | ❌ Too short, traffic varies |
| 48-72 hours | ✅ Minimum recommended |
| 7 days | ✅✅ Good for most videos |
| 14 days | ✅✅✅ Best for accuracy |
Statistical Significance
What It Means: The probability that your results aren’t due to random chance.
Target: 95% confidence (industry standard)
Calculation:
- Most tools calculate automatically
- Manual: Use online A/B significance calculators
- Input: Impressions and clicks for each variant
Avoiding Bias
✅ Do:
- Let the test run its full duration
- Test during similar traffic periods
- Document all variables
❌ Don’t:
- Stop tests early when you “see a winner”
- Change other video elements mid-test
- Run tests during unusual traffic spikes (holidays, viral events)
Advanced Testing Strategies
Multi-Variant Testing
Test 4+ thumbnails simultaneously using tools like ThumbnailTest.com.
Best For:
- Exploring completely different directions
- New channels without established style
- Major rebranding
Caution: Requires more impressions for significance.
Sequential Testing
Test winners iteratively:
- Test A vs. B → Winner: A
- Test A vs. C → Winner: C
- Test C vs. D → Winner: C (final)
Benefit: Continuously improves over time.
Niche-Specific Considerations
| Niche | What Works Best |
|---|---|
| Gaming | Action shots, bright colors, character faces |
| Education | Clean text, trust signals, curious expressions |
| Vlogging | Authentic emotions, lifestyle imagery |
| Tech | Product focus, minimal text, sleek backgrounds |
| Finance | Numbers, growth imagery, professional look |
10 Real Case Studies
Case Study 1: Expression Change
Channel: General creator Change: Neutral face → Surprised expression Result: +47% CTR Lesson: Exaggerated emotions trigger curiosity
Case Study 2: Added Text
Channel: Tutorial channel Change: Image only → Added 3-word hook Result: +32% CTR Lesson: Text provides context and promise
Case Study 3: Removed Clutter
Channel: Gaming channel Change: Busy background → Clean gradient Result: +28% CTR Lesson: Mobile viewers need clarity
Case Study 4: Ali Abdaal
Change: Thumbnail redesign Result: +800k views (300k → 1.1M on same video) Lesson: One thumbnail can transform video performance
Case Study 5: Color Contrast
Channel: Epidemic Sound users Change: Low contrast → High contrast colors Result: 23% average CTR improvement Lesson: Standing out in feed matters
Case Study 6: Face Addition
Channel: Product review channel Change: Product only → Product + creator face Result: +35% CTR Lesson: Human connection drives clicks
Case Study 7: Text Position
Channel: Cooking channel Change: Bottom text → Top-left text Result: +18% CTR Lesson: Avoid timestamp overlap area
Case Study 8: Background Color
Channel: Educational Change: White background → Blue gradient Result: +22% CTR Lesson: Color differentiation from competition
Case Study 9: Font Change
Channel: Various Change: Thin font → Bold Impact style Result: +15% CTR average Lesson: Readability is non-negotiable
Case Study 10: Systematic Tester
Channel: Reddit creator (6 months documented) Change: Tested every upload Result: CTR doubled over 6 months (3.2% → 6.8%) Lesson: Consistency compounds
Reading Analytics & CTR Benchmarks
CTR Benchmarks by Niche
| Niche | Average CTR | Good CTR | Excellent CTR |
|---|---|---|---|
| Gaming | 4-6% | 7-10% | 12%+ |
| Education | 3-5% | 6-8% | 10%+ |
| Entertainment | 5-8% | 9-12% | 15%+ |
| Tech Reviews | 3-5% | 6-9% | 11%+ |
| Vlogs | 4-7% | 8-11% | 13%+ |
When to Stop a Test
✅ Stop when:
- 95% statistical significance reached
- Set duration completed
- 5,000+ impressions per variant
❌ Don’t stop just because:
- One variant is “clearly” winning (early data is unreliable)
- You’re impatient
- Results aren’t what you expected
Declaring a Winner
Clear Winner: 10%+ CTR difference with 95% significance Slight Advantage: 5-10% difference (consider other factors) No Difference: <5% difference (variants are equally effective)
Implementing Winners
Updating Thumbnails
- Go to YouTube Studio → Content
- Select the video
- Click Thumbnail → Replace with winner
- Document what worked and why
Template Creation from Winners
Turn winning designs into reusable templates:
- Save the PSD/Canva file as “Winning Template”
- Note the specific elements that worked:
- Color scheme
- Text style and position
- Expression type
- Composition
- Apply to future videos
Building an Ongoing Testing Culture
Testing Schedule:
- Weekly: Test 2-3 videos
- Monthly: Review all winners, update templates
- Quarterly: Analyze trends across tests
Common Testing Mistakes
1. Testing Too Many Variables
❌ Changing color, text, AND expression = unclear results ✅ Change ONE variable at a time
2. Short Test Duration
❌ 24-hour tests miss traffic patterns ✅ Run for 48-72 hours minimum
3. Ignoring Mobile Performance
❌ Designing only for desktop preview ✅ 70% of YouTube views are mobile—test at small sizes
4. Not Documenting Results
❌ Running tests but forgetting what worked ✅ Keep a testing log: date, variants, results, learnings
5. Stopping Early
❌ Declaring winners after 500 impressions ✅ Wait for 1,000+ impressions minimum
Free vs. Paid Testing Tools
| Aspect | Free (YouTube Test & Compare) | Touhfa Arena (Free, Community) | Paid (TubeBuddy/VidIQ/ThumbnailTest) |
|---|---|---|---|
| Variants | Up to 3 | 2 | Up to 10+ |
| When | Post-publish only | Pre-publish | Both |
| Metrics | CTR/watch time | Real vote percentage | Full analytics, significance |
| Requirements | YouTube channel + traffic | None | Account/subscription |
| Cost | $0 | $0 | $9-75/month |
| Feedback type | Algorithm data | Real human votes | Algorithm + AI |
| Best For | Optimization after upload | Validation before upload | Scale, precision |
Our Recommendation
The ideal workflow in 2026 combines three stages:
- Before creating: Use Touhfa Arena to validate your strongest design concepts with real community votes - completely free, no publishing required
- After publishing: Activate YouTube’s free native Test & Compare to optimize with real algorithm data
- At scale: Upgrade to TubeBuddy Pro ($9/month) when running multiple channels or needing statistical significance automation
Start with YouTube’s free tools to learn the basics. Once you’re testing regularly and want more variants and data, consider TubeBuddy Pro.
ROI of A/B Testing
Is it worth the effort?
The Math:
- Average CTR improvement: 23%
- Some channels: 100%+ improvement (doubled)
- More clicks = more views = more revenue
The Cost:
- Free: YouTube’s built-in tool
- Paid: $9-49/month for advanced tools
The Verdict: ✅ Yes, absolutely worth it for growing channels
Even a 20% CTR improvement on a video with 100,000 impressions means 20,000 extra clicks—and potentially thousands more subscribers.
High CPC Note: The keyword “youtube thumbnail a/b testing” has a CPC of ₹688.60—indicating advertisers pay a premium to reach creators interested in optimization. This tells you how valuable this skill is.
Your A/B Testing Action Plan
- ✅ Before creating: Submit your 2-3 thumbnail concepts to Touhfa Arena for free community votes
- ✅ After publishing: Activate YouTube’s free Test & Compare for algorithm-level optimization
- ✅ Track results: Document winners in a spreadsheet with what variable changed
- ✅ Apply learnings: Update future thumbnails based on accumulated data
- ✅ Scale up: Consider TubeBuddy Pro when running multiple channels
- ✅ Build culture: Test 20% of videos regularly - consistency compounds
Remember: The goal isn’t to test everything - it’s to learn what works for YOUR audience and apply those insights consistently.
Community-Based Thumbnail Testing: A New Approach
The landscape of thumbnail testing changed significantly in 2024-2026. Beyond algorithmic tools and AI analyzers, a third category has emerged: community thumbnail testing - getting real human votes before you spend a single impression.
What Is Community Thumbnail Testing?
Community thumbnail testing is the practice of submitting two or more thumbnail designs to a real audience of viewers who vote on which one they would actually click. Unlike AI analyzers (which score technical attributes like contrast, face presence, and text readability), community testing measures the one thing that actually matters: would a real human click this?
The results are expressed as a simple percentage split - for example, 67% of voters prefer Thumbnail A vs 33% for Thumbnail B. This gives you a directional signal that is far easier to act on than an AI score of “7.2/10 on visual impact.”
How Touhfa Arena Works (Step-by-Step)
Touhfa Arena is the free community voting platform built specifically for YouTube thumbnail A/B testing:
- Upload your two thumbnail variants - drag and drop your design files (PNG or JPG)
- Add context - optionally add your video title so voters can judge relevance
- Share your test - your thumbnails are added to the voting queue
- Real creators vote - members of the creator community vote on which thumbnail they would click
- Review results - you receive a clear percentage breakdown showing which design won and by how much
- Upload the winner - publish your tested, community-validated thumbnail to YouTube
The entire process costs nothing and requires no YouTube channel, no subscribers, and no existing audience.
Start your free thumbnail A/B test in the Touhfa Arena →
Why Real Human Votes Beat AI Scores
AI thumbnail analyzers measure what they can quantify: contrast ratios, face detection confidence scores, text pixel size, color saturation levels. These are useful technical baseline checks.
But they cannot measure:
- Trend awareness - whether a particular style is oversaturated in your niche right now
- Scroll-stopping appeal - what catches attention among the specific thumbnails competing in your feed context
- Cultural resonance - whether a meme format, reference, or expression connects with your specific audience
- Curiosity gap - whether the combination of thumbnail + title creates the specific tension that drives clicks
Real voters evaluate thumbnails the way they browse YouTube: as one option in a competitive feed. An AI evaluates it in isolation. That difference is significant.
A thumbnail that scores 8.5/10 from an AI analyzer but loses 35% to 65% in community voting is telling you something important. Always trust the humans.
When to Use Community Testing vs YouTube’s Native Tool
| Scenario | Best Tool | Reason |
|---|---|---|
| Before uploading (concept validation) | Touhfa Arena | No published video required, instant community feedback |
| After uploading (performance optimization) | YouTube Test & Compare | Real algorithm data from your actual audience |
| Both stages | Both | Pre-publish validates, post-publish optimizes |
| No existing YouTube traffic | Touhfa Arena | Works without channel traffic or subscribers |
| Channel with 10K+ monthly impressions | YouTube Native | Enough data for statistical significance |
The ideal workflow: use Touhfa Arena as a filter before publishing, then use YouTube’s native tool after publishing to confirm and further optimize.
Related Guides: The Complete Thumbnail Testing Cluster
This pillar guide covers the full methodology. For deeper dives into specific topics, explore the complete cluster:
AI Thumbnail Analyzers vs Real Community Voting AI tools score contrast and faces, but they cannot tell you what real viewers will click. This guide breaks down exactly where AI analyzers fall short and why human votes are a stronger CTR signal - plus the hybrid workflow that uses both.
YouTube Test & Compare vs Free Community A/B Testing YouTube’s native tool is powerful but has real limits: you must publish first, you need existing traffic, and results take days. This comparison shows exactly when to use each tool and why the best answer is both - at different stages.
8 Best YouTube Thumbnail A/B Testing Tools in 2026 A tested, hands-on review of every major thumbnail testing tool - from free community voting to $75/month enterprise tools. Includes a full comparison table to find the right option for your channel size and budget.
Does A/B Testing Really Increase YouTube CTR? The data behind thumbnail testing: what actually moves CTR, realistic improvement benchmarks by niche, and how to measure your own before/after lift with YouTube Analytics.
How Top YouTubers Test Their Thumbnails Before Publishing From MrBeast’s documented thumbnail obsession to in-house design team workflows - this guide breaks down how large channels approach thumbnail testing and how smaller creators can replicate the same process for free.