Creators who implement systematic thumbnail testing report CTR improvements of 37% or higher. But does A/B testing actually move the needle in a measurable, predictable way - or are those numbers cherry-picked outliers? This guide breaks down how YouTube CTR actually works, what genuinely affects it, and what realistic improvement looks like when you test consistently.
Want the full testing methodology? Start with the complete guide: YouTube Thumbnail A/B Testing: Free Community Voting and Tools 2026
How YouTube CTR Actually Works
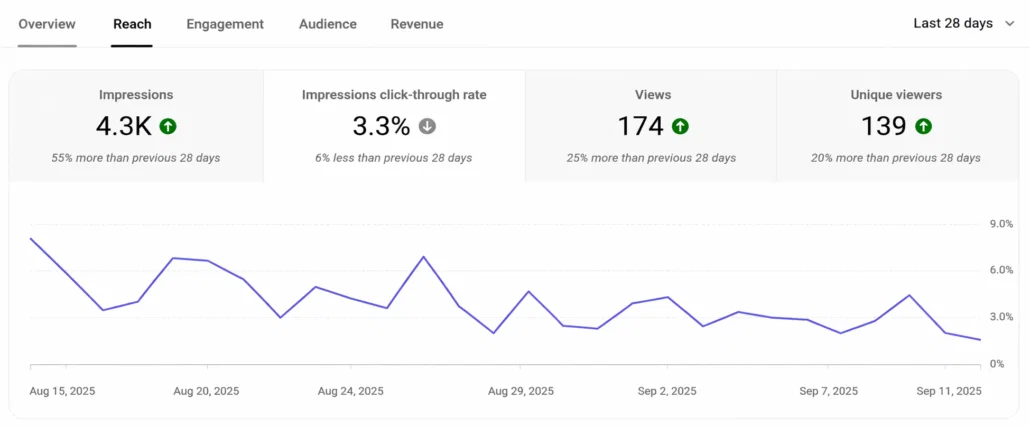
Within the YouTube ecosystem, the click-through rate (CTR) is a fundamental metric that measures the percentage of viewers who choose to click on a video after being presented with its thumbnail as an impression. However, treating a channel’s overall CTR as a single, uniform indicator of performance is a systemic analytical error. A video’s aggregate CTR is actually a composite metric derived from highly distinct audience behaviors occurring across entirely different discovery environments within the platform.
Impressions on YouTube predominantly occur in four primary discovery zones: search results, browse features (the home feed), suggested videos (the sidebar or autoplay sequence), and external referral sources. For creators utilizing short-form content, the YouTube Shorts feed operates on a fundamentally distinct mechanical paradigm, substituting traditional click-based discovery with a swiping behavior that utilizes a “viewed versus swiped away” metric.
The variance in CTR across these traffic sources is intrinsically tethered to viewer intent and psychological context. Search traffic consistently produces the highest CTR metrics on the platform, precisely because viewers are actively seeking a specific solution or topic. Conversely, browse features generate a significantly lower baseline CTR because the audience is in a passive, high-friction discovery mode. Suggested videos typically yield a moderate CTR, benefiting from the fact that the viewer has already established contextual interest by watching a topically adjacent video.
| Traffic Source | Typical CTR Benchmark | Viewer Intent Context |
|---|---|---|
| YouTube Search | 8.0% - 15.0% | High intent - actively seeking specific information or topics |
| Suggested Videos | 5.0% - 10.0% | Moderate intent - continuing a session based on topical adjacency |
| Browse / Home Feed | 3.0% - 7.0% | Low intent - passive discovery requiring high-friction scroll stopping |
| Subscriptions Feed | 7.0% - 10.0%+ | High intent - established parasocial relationship and brand loyalty |
What Affects Thumbnail CTR the Most
Faces and Emotional Expression
Human biology dictates a profound visual bias toward facial recognition, making human faces one of the most statistically significant variables in thumbnail performance. The human brain utilizes the fusiform gyrus, a specialized region physically hardwired to recognize and process facial expressions, turning faces into biological attention magnets.
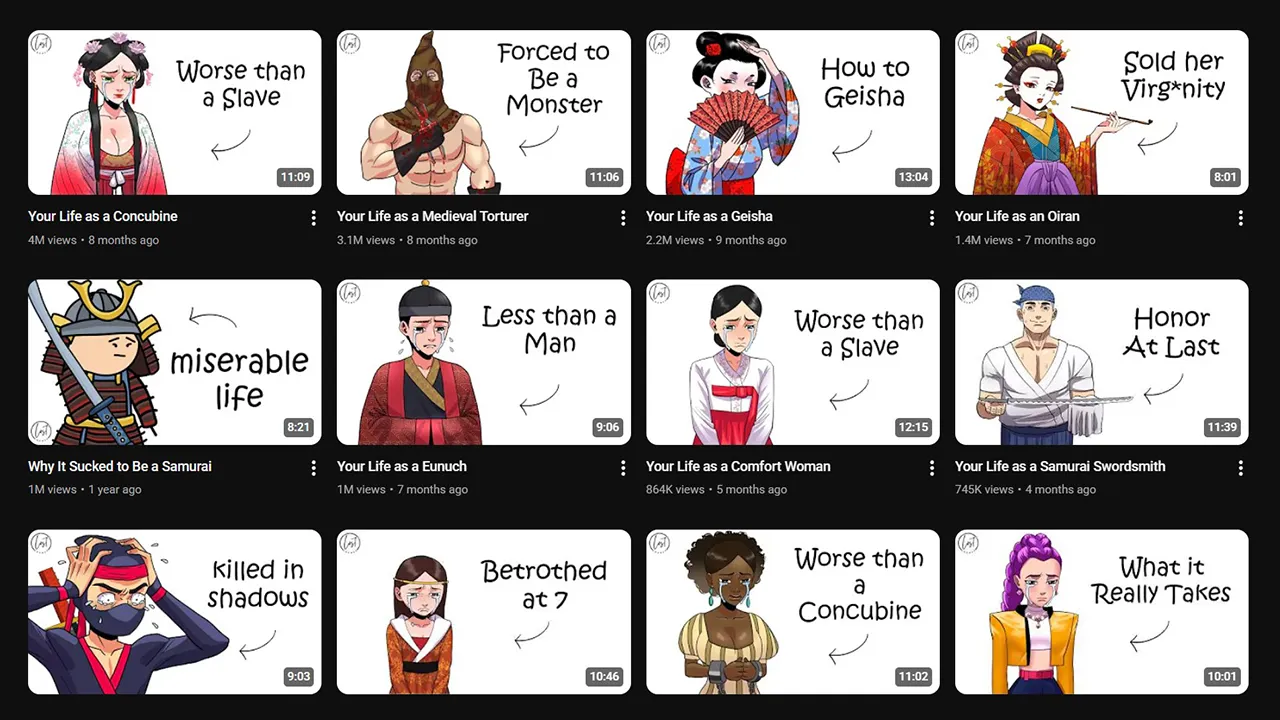
Empirical data indicates that thumbnails prominently featuring expressive human faces routinely experience a CTR increase ranging from 30% to 50%. However, contemporary thumbnail psychology has evolved - audiences have grown deeply desensitized to the artificial, exaggerated “YouTube face” that once dominated the platform. Current performance data demonstrates that authentic, relatable emotional expressions that genuinely match the video’s underlying context yield substantially higher viewer retention and increase organic clicks by over 42%. Furthermore, establishing direct eye contact within the composition is crucial, as it creates an immediate psychological connection with the viewer, functioning as a powerful social proof mechanism.
Contrast and Color Pop
To effectively interrupt a user’s scrolling behavior, a thumbnail must visually detach itself from the surrounding digital interface through deliberate contrast. High-contrast compositional techniques - such as utilizing bright yellow or red focal elements set against deeply shadowed or darkened backgrounds - are consistently associated with up to a 20% increase in CTR.
Effective color popping requires strategic avoidance of the platform’s native interface colors. Relying too heavily on standard reds, whites, or blacks can cause the primary design elements to camouflage seamlessly into YouTube’s light or dark mode user interface. A highly reliable diagnostic technique involves zooming the canvas out to the approximate size of a postage stamp to verify that the primary subjects and contrasting colors remain distinct without relying on minute graphic details.
Text Readability at Small Sizes (Mobile)
The physical device through which a viewer interacts with YouTube fundamentally alters visual processing requirements, establishing mobile-first design as a strict functional necessity. Industry data indicates that over 70% of Generation Z views, and nearly 92% of users aged 16 to 24, occur on mobile smartphones. A densely detailed thumbnail that appears pristine on a desktop monitor frequently degrades into an illegible visual blur on a mobile screen.
Performance analytics demonstrate that minimalist text integration is mathematically superior - thumbnails containing four words or fewer achieve a 30% higher CTR compared to text-heavy alternatives. Optimal readability is achieved by utilizing bold, high-contrast, sans-serif typography while strictly avoiding intricate script fonts or placing any critical text in the bottom right corner, a zone perpetually obscured by the platform’s native timestamp overlay.
Relevance to Title and Topic
Engineering a highly clickable image that subsequently fails to align with the video’s core promise introduces severe algorithmic penalties. The modern YouTube recommendation engine is heavily optimized for long-term viewer satisfaction, heavily weighting a metric officially classified as “watch time share.”
When a thumbnail utilizes misleading clickbait architecture, it may successfully generate a transient spike in initial CTR, but this will inevitably be counteracted by a precipitous drop in average view duration (AVD). Maximum optimization occurs when the title and thumbnail operate synergistically: the image visually establishes an emotional curiosity gap, while the title immediately clarifies the contextual intent without resorting to deceptive framing.
Why One Person’s Opinion Is Not a Reliable CTR Predictor
Predicting the success of a specific thumbnail variation based entirely on a creator’s gut feeling or a solitary designer’s aesthetic intuition introduces severe cognitive bias into the optimization workflow. The creator inherently suffers from the “curse of knowledge,” possessing complete contextual awareness of the video’s narrative arc. This deep familiarity fundamentally blinds the creator to how a completely uninitiated viewer, scrolling rapidly through a densely populated feed, will interpret a single isolated frame.
The statistical framework known as the wisdom of crowds consistently demonstrates that aggregating independent judgments from a broad, diverse population routinely outperforms the isolated intuition of assumed experts. Relying on a single individual’s opinion regarding thumbnail superiority fails to account for the highly variable demographic, psychological, and situational factors of an audience that generates tens of thousands of daily impressions.
To effectively neutralize individual cognitive biases, creators require multiple, independent voter responses or, preferably, real-world impression data extracted from active feed environments. Platforms like Touhfa Arena are built specifically for this: blind community voting ensures every vote is cast independently, without the contamination of social proof or prior opinions. By transferring the decision-making process from individual intuition to aggregate behavioral data, creators accurately capture the genuine psychological preferences of the broader market.
What Happens When You Test Before Publishing vs After
Implementing a strategic A/B testing workflow fundamentally alters the performance trajectory of a video during its most critical lifecycle phases.
Testing before publishing - often facilitated through community panels or third-party polling applications - enables creators to aggressively screen out objectively weak concepts before the video is introduced to the live algorithm. The predominant advantage of pre-publishing optimization is the fierce protection of the video’s critical first 48 hours. When a video launches with a mathematically verified, highly optimized thumbnail, it rapidly captures early momentum from the channel’s core subscriber base, broadcasting intense initial satisfaction signals that effectively compel the algorithm to distribute the content outward to broader browse audiences.
Testing after publishing relies predominantly on YouTube’s native Test and Compare infrastructure. This sophisticated internal tool equitably divides live algorithmic traffic across up to three uploaded variants and evaluates performance utilizing real viewer data - specifically measuring accumulated watch time share rather than merely isolating raw clicks. While this methodological approach is exceptionally accurate because it tests the genuine target audience in a natural behavioral environment, it carries the inherent risk of sacrificing initial launch velocity if a weak variant is served to early viewers.
The most statistically sound modern workflow amalgamates both methodologies. Advanced creators utilize pre-publish screening environments - such as Touhfa Arena’s free community voting - to eliminate fundamentally flawed design concepts, ensuring that the variants ultimately uploaded to the native YouTube Test and Compare tool are already highly competitive and thoroughly refined. This layered approach allows the platform’s algorithm to definitively crown a statistical winner based on long-term watch time metrics without severely penalizing the video’s highly sensitive launch window.
See the full comparison: YouTube Test and Compare vs Free Community A/B Testing - a detailed breakdown of when to use each tool and why the best answer is both.
Realistic CTR Improvement: What to Actually Expect
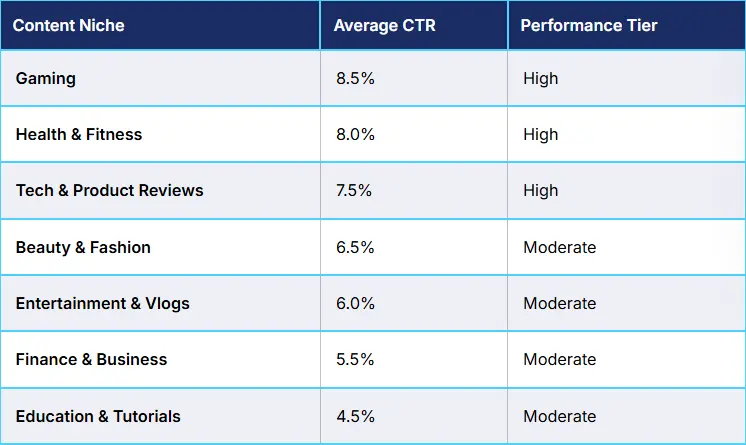
Establishing realistic optimization benchmarks requires the explicit acknowledgment that average CTR metrics fluctuate drastically depending on the specific content vertical.
| Niche / Content Category | Typical CTR Benchmark | Key Influencing Factors |
|---|---|---|
| Gaming | 3.0% - 8.5% | Extreme saturation - requires intense personality branding and loyal subscriber retention |
| Education and How-To | 3.0% - 7.0% | Heavy reliance on search traffic - audiences actively compare multiple competitive results |
| Entertainment and Comedy | 3.0% - 9.0% | Highly variable - deeply dependent on high-energy facial expressions and rapid emotional hooks |
| Technology and Reviews | 4.0% - 8.0% | Driven by cyclical product curiosity and immense search intent during major hardware launches |
| Vlogs and Lifestyle | 2.0% - 6.0% | Lower baseline - heavily reliant on pre-existing creator-viewer parasocial dynamics |
Through disciplined, systematic A/B testing, channels typically observe relative CTR improvements ranging from 15% to 30% above their established historical baselines. The mathematical leverage associated with these seemingly minute percentage points is immense:
- An absolute baseline increase from 3% to 4% CTR across 100,000 impressions = 1,000 additional organic views
- A 30% relative CTR lift in high-value verticals (B2B software, personal finance, RPMs of $12-$22) = exponential advertising revenue growth without additional production costs
How to Measure Your Own Before/After CTR Lift
Executing a controlled, mathematically valid measurement of CTR lift requires adherence to a disciplined, data-oriented methodology.
Step 1 - Record Baseline CTR Before Testing: Prior to initiating any structural modifications to the video’s packaging, access the YouTube Studio Analytics dashboard. Navigate directly to the Reach tab to identify and meticulously record the historical CTR, the total accumulated impressions, and the average view duration for the specific video under evaluation. This documentation serves as the essential control metric for future comparative analysis.
Step 2 - Run Tests and Apply Winners: Utilize the native Test and Compare feature to seamlessly upload up to three distinct thumbnail variants. To achieve genuine statistical significance, it is mathematically vital to allow the test to run uninterrupted for a minimum duration of 10 to 14 days, particularly for content generating fewer than 10,000 daily impressions. The platform’s internal architecture will automatically evaluate the variants based strictly on watch time share - not easily manipulated clicks - and declare a definitive algorithmic winner.
Step 3 - Compare 30-Day CTR Averages: Once the winning thumbnail is permanently applied to the video, aggressively monitor the asset’s performance over a subsequent 30-day evaluation window. Utilize the “Advanced Mode” interface within YouTube Analytics, selecting the “Compare to…” function to rigorously evaluate the pre-test baseline period against the post-test optimization period. The ultimate indicators of a mathematically successful optimization are a stabilized or elevated CTR accompanied simultaneously by a sustained or actively increased average view duration.
Frequently Asked Questions
What is a good CTR for YouTube?
A broadly accepted baseline for a “good” CTR generally falls between 4% and 6%, with sustained rates exceeding 6% classified as indicators of exceptionally strong performance. However, this metric is profoundly contextual and fluid. A newly published video aggressively pushed directly to a dedicated subscriber feed may briefly achieve a CTR of 8% to 10% during its initial hours, whereas an older, evergreen video subsequently pushed outward to a vast, uninitiated browse audience will naturally and correctly settle between 3% and 5% as the algorithm expands its reach.
Does changing a thumbnail reset the YouTube algorithm?
No, altering a thumbnail does not “reset” the algorithm, nor does it wipe historical performance data. The YouTube recommendation architecture operates on a continuous, real-time feedback loop explicitly designed to pull relevant content for specific viewers based upon long-term satisfaction metrics, rather than simply pushing content based on metadata. Changing a thumbnail merely introduces a new visual packaging variable into the system - if the newly applied image demonstrably improves viewer satisfaction and overall watch time share, the recommendation system will naturally and organically accelerate its distribution velocity in direct response to the newly generated positive behavioral signals.
How long should I wait before checking CTR results?
For genuine statistical significance to be reached, A/B tests must typically run for a period of 10 to 14 days. If a specific video generates an exceptionally high volume of traffic - for instance, exceeding 10,000 algorithmic impressions per day - statistical significance may occasionally be reached in a matter of 72 hours. Conversely, prematurely concluding a test after merely 48 hours on a slow-moving, low-impression video relies almost entirely on random statistical noise rather than actionable, reliable behavioral data, actively damaging the optimization process.
Related Guides
- YouTube Thumbnail A/B Testing: Complete 2026 Guide - The full pillar guide covering all methods, tools, CTR benchmarks, and step-by-step walkthroughs
- AI Thumbnail Analyzers vs Real Community Voting - Why AI scores fall short and when human votes give you a stronger CTR signal
- YouTube Test and Compare vs Free Community Testing - When to use each tool and why the best answer is both, at different stages
- 8 Best YouTube Thumbnail A/B Testing Tools in 2026 - Full comparison of every major tool from free community voting to $75/month enterprise platforms
- How Top YouTubers Test Their Thumbnails Before Publishing - How large channels approach thumbnail testing and how smaller creators can replicate it for free